Portfolio health at a glance, without pulling a single export
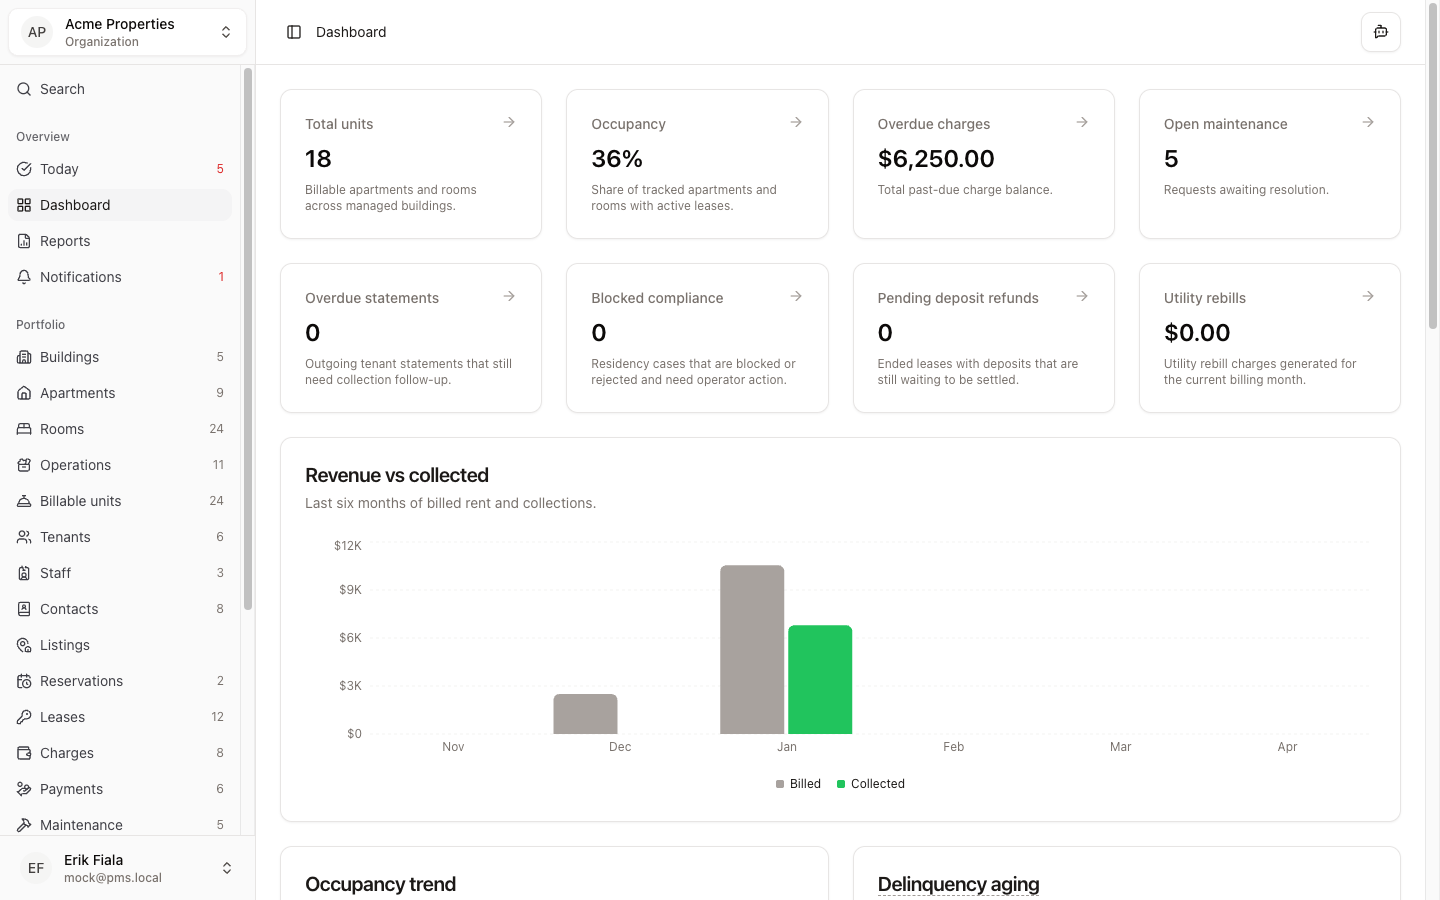
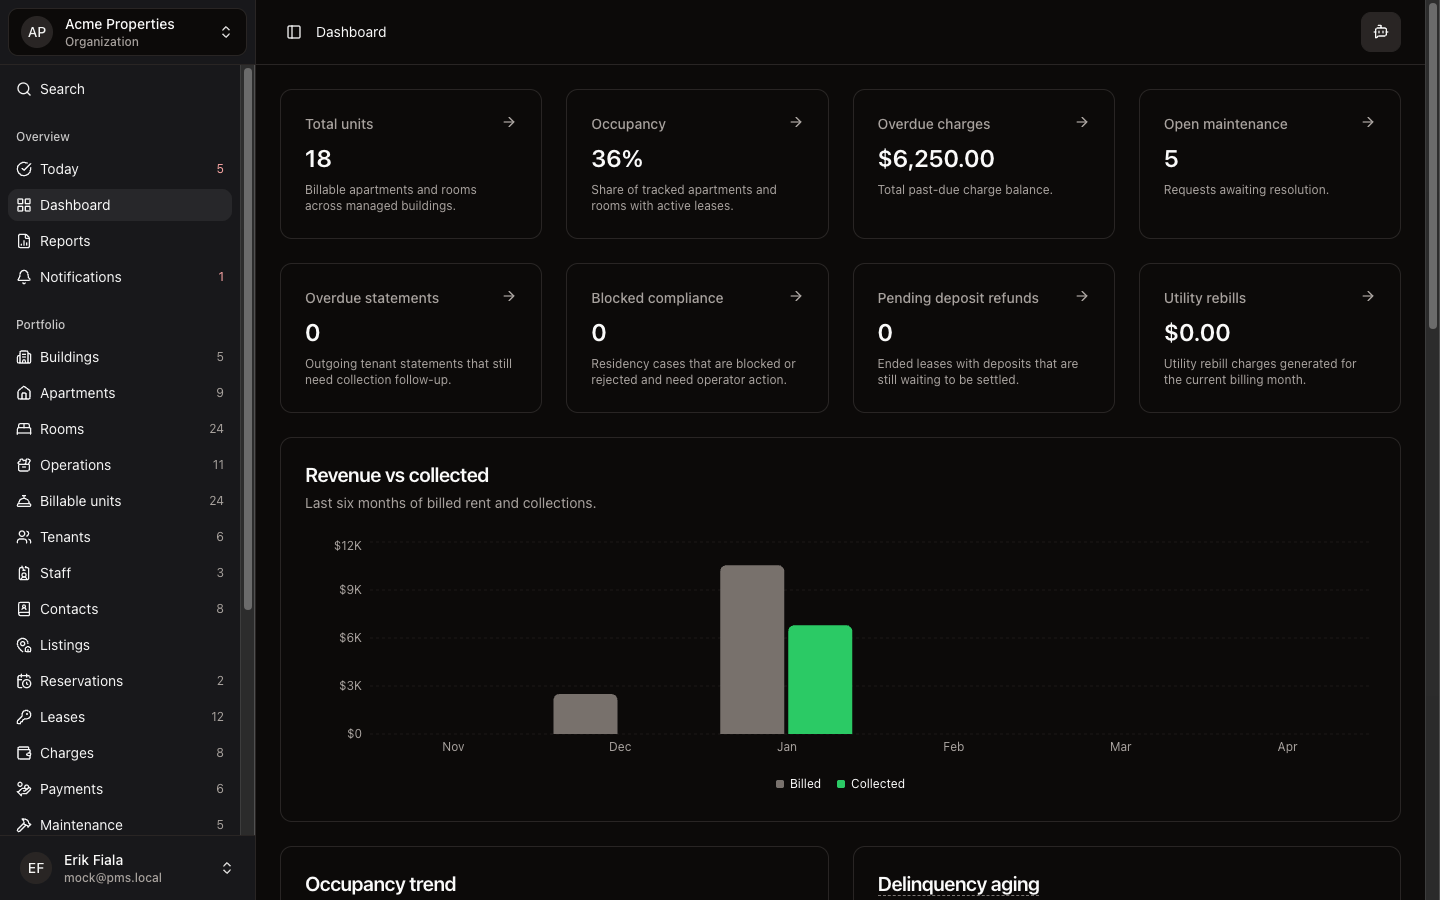
Dashboard aggregates occupancy, outstanding balances, and recent operational activity so owners and operators stay oriented without leaving the screen.
Connected areas inside Hausive
Dashboard draws from live portfolio data so the numbers reflect actual occupancy, rent status, and recent changes.
Occupancy summary
Snapshot of filled and vacant units across the portfolio.
Balance overview
Outstanding, paid, and overdue rent at a glance.
Recent activity
Latest updates across leases, charges, payments, and tickets.
How teams usually run it
Most teams open Dashboard at the start of owner meetings or weekly reviews to anchor the conversation in real numbers.
Open Dashboard before owner calls
Anchor the conversation in live occupancy and balance data.
Spot anything that needs follow-up
Overdue balances or recent changes surface without manual digging.
Navigate to the detail from there
Click through to the relevant module to investigate or act.
What gets easier
Owners get context fast, and operators spend less time preparing for check-ins.
Faster owner prep
The numbers are already organized when the meeting starts.
Portfolio-wide visibility
Occupancy and collections stay visible without stitching exports together.
Better-informed decisions
Teams act on current data, not last week's spreadsheet.
Want a live read on occupancy and collections?
We can show you how Dashboard keeps the whole team aligned on portfolio health without building reports by hand.
More Overview modules
Today
Start each day from a single queue that surfaces the next setup task or the most urgent operational item across your portfolio.
Reports
Generate owner reports, upload invoices, and keep documents and media attached to the work instead of scattered across folders.
Notifications
Review alerts and updates that need attention across leases, payments, maintenance, and reservations so nothing time-sensitive slips past.